Duration matching TIPS with delayed SPIA
Since one of the key elements of delayed SPIA approach is duration matching the TIPS (whether a single TIPS, a pair or a collection of TIPS funds) being used to supply the premium after the delay period, I thought I would look at this a bit more systematically than earlier in the thread.
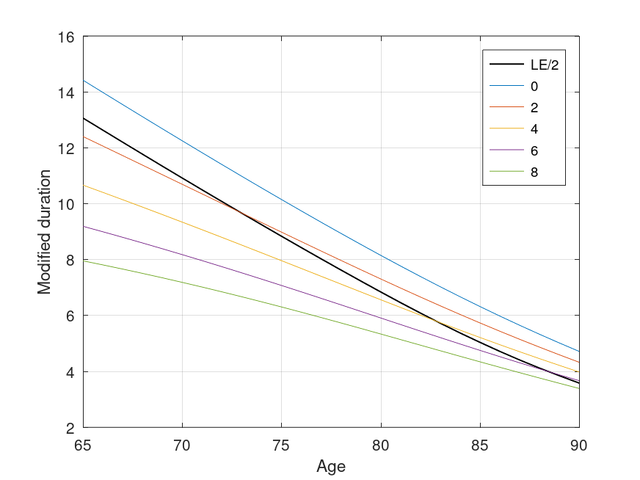
The following is a graph of a) Life expectancy/2 and b) the duration of an annuity at each age at different yields (0%, 2%, 4%, 6%, and 8%) as a function of SPIA purchase age (I'll give some details of how this has been calculated below).
![Image]()
There are a number of key points:
1) Half the life expectancy (as mentioned upthread) is a reasonable first approximation to the duration, but
2) the yield does make some difference (a smaller difference with increasing purchase age), with LE/2 being close to the annuity duration for lower yields at earlier ages and higher yields for later ages.
Method
1) I've used SOA annuitant 2012 IAM period table (https://mort.soa.org) converted to a cohort (generational) table using the projection factors at https://www.actuary.org/sites/default/f ... -28-11.pdf (page 31 onwards for the tables and method). The example plotted above is for a 65 year old female born in 1959 (i.e., they are 65 in 2024).
2) The calculation of payout rates (not shown, but needed for duration - see next step) has essentially followed the method of Pfau (see https://retirementresearcher.com/income-annuity-101/)
3) The duration (which is the duration expected at the future purchase age) has been calculated by finding the annuity payout rate, P1 and P2 (expressed as a percentage of premium) for two yields which are 10 basis points apart. The modified duration is then approximately
modified duration ~ 100*(P2-P1)/(P1*0.01)
I note that the SOA table is now more than 10 years old and the last decade has been unusual in terms of mortality rates and life expectancy (with declines in population expectancies) and that the payout rates calculated using this methods are more conservative than those actually available.
I also note that there are some additional considerations in terms of duration matching
1) The annuity payout rates have been calculated assuming a flat yield curve. While a rising curve, will lead to lower weighted maturity and duration, I have not quantified this.
2) The duration of a TIPS is matched with an (in reality) unknown collection of nominal bonds. While yields for TIPS and nominal bonds will be correlated to some extent, varying market expectations of inflation and realised inflation will reduce the correlation to below 1. I have not modelled this and have no idea how big the effect will be (my, limited, understanding is that the duration of TIPS will depend on the nominal cash flows, so will vary with realised/expected inflation, e.g. see Chapter 7 of https://www.lseg.com/content/dam/ftse-r ... o-calc.pdf).
cheers
StillGoing
Since one of the key elements of delayed SPIA approach is duration matching the TIPS (whether a single TIPS, a pair or a collection of TIPS funds) being used to supply the premium after the delay period, I thought I would look at this a bit more systematically than earlier in the thread.
The following is a graph of a) Life expectancy/2 and b) the duration of an annuity at each age at different yields (0%, 2%, 4%, 6%, and 8%) as a function of SPIA purchase age (I'll give some details of how this has been calculated below).
There are a number of key points:
1) Half the life expectancy (as mentioned upthread) is a reasonable first approximation to the duration, but
2) the yield does make some difference (a smaller difference with increasing purchase age), with LE/2 being close to the annuity duration for lower yields at earlier ages and higher yields for later ages.
Method
1) I've used SOA annuitant 2012 IAM period table (https://mort.soa.org) converted to a cohort (generational) table using the projection factors at https://www.actuary.org/sites/default/f ... -28-11.pdf (page 31 onwards for the tables and method). The example plotted above is for a 65 year old female born in 1959 (i.e., they are 65 in 2024).
2) The calculation of payout rates (not shown, but needed for duration - see next step) has essentially followed the method of Pfau (see https://retirementresearcher.com/income-annuity-101/)
3) The duration (which is the duration expected at the future purchase age) has been calculated by finding the annuity payout rate, P1 and P2 (expressed as a percentage of premium) for two yields which are 10 basis points apart. The modified duration is then approximately
modified duration ~ 100*(P2-P1)/(P1*0.01)
I note that the SOA table is now more than 10 years old and the last decade has been unusual in terms of mortality rates and life expectancy (with declines in population expectancies) and that the payout rates calculated using this methods are more conservative than those actually available.
I also note that there are some additional considerations in terms of duration matching
1) The annuity payout rates have been calculated assuming a flat yield curve. While a rising curve, will lead to lower weighted maturity and duration, I have not quantified this.
2) The duration of a TIPS is matched with an (in reality) unknown collection of nominal bonds. While yields for TIPS and nominal bonds will be correlated to some extent, varying market expectations of inflation and realised inflation will reduce the correlation to below 1. I have not modelled this and have no idea how big the effect will be (my, limited, understanding is that the duration of TIPS will depend on the nominal cash flows, so will vary with realised/expected inflation, e.g. see Chapter 7 of https://www.lseg.com/content/dam/ftse-r ... o-calc.pdf).
cheers
StillGoing
Statistics: Posted by StillGoing — Fri Jun 21, 2024 4:25 am — Replies 77 — Views 7685